
In 2025, Mercari aims to partner with even more local governments
Welcome to 2025!
Thank you for visiting Merpoli again this year.
As we mentioned in our final article of 2024, last year we focused on promoting a circular economy by increasing collaboration with external stakeholders, such as the federal government, local governments, schools, organizations, and corporations.
In 2025, we hope to further expand on initiatives tackling social problems through collaboration with local governments and to make such initiatives a standard for more governments.
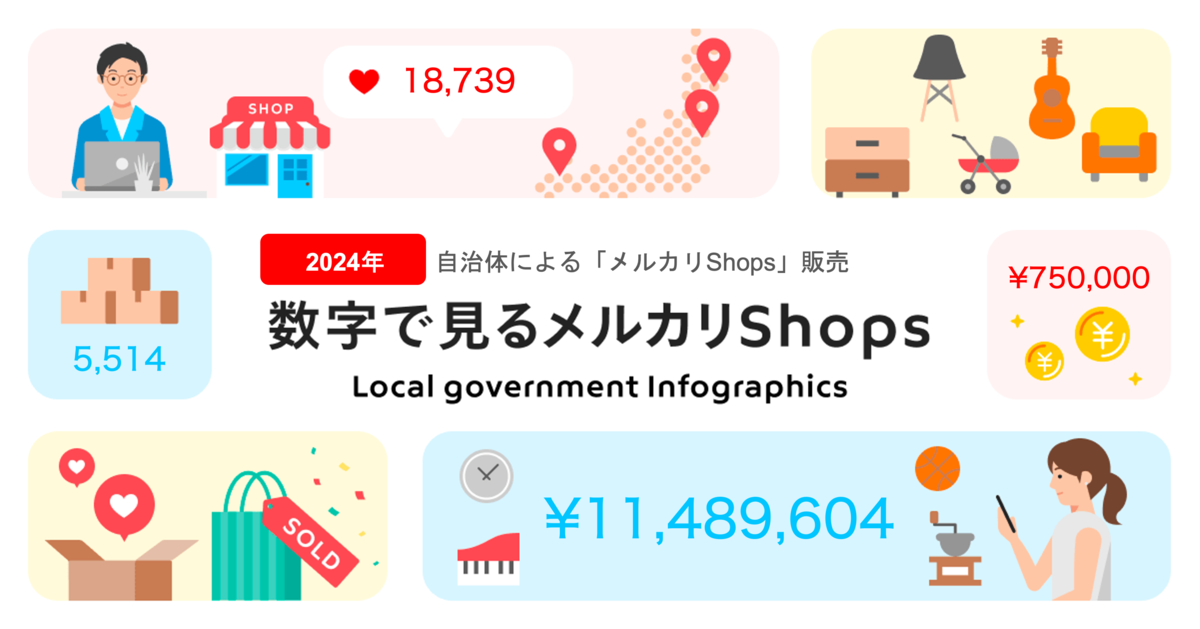
With this in mind, the second installment of Merpoli’s second article of the new year will feature a summary of the sales performance of local governments over the past year on Mercari Shops, symbolizing our collaboration efforts.
Total sales revenue by local government-run shops in 2024 exceeded 10M JPY
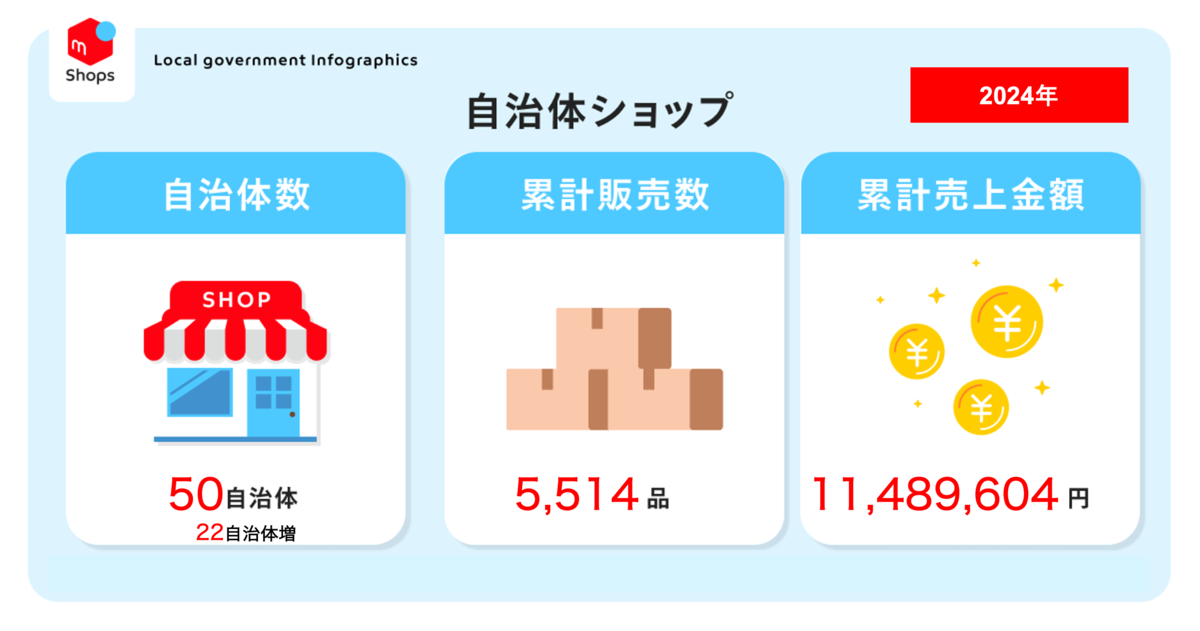
Sales by government-run shops on Mercari Shops began on November 25, 2021, when the town of Yamada in Iwate began selling equipment from schools that were shut down and merged with other schools in the town. By the end of 2023, 28 local governments were selling on Mercari Shops. In 2024, 22 new local governments opened shops over the months, and we have now reached a total of 50 government-run shops.
Throughout 2024, 5,514 items were sold by local governments for a total of 11,489,604 JPY in sales proceeds.
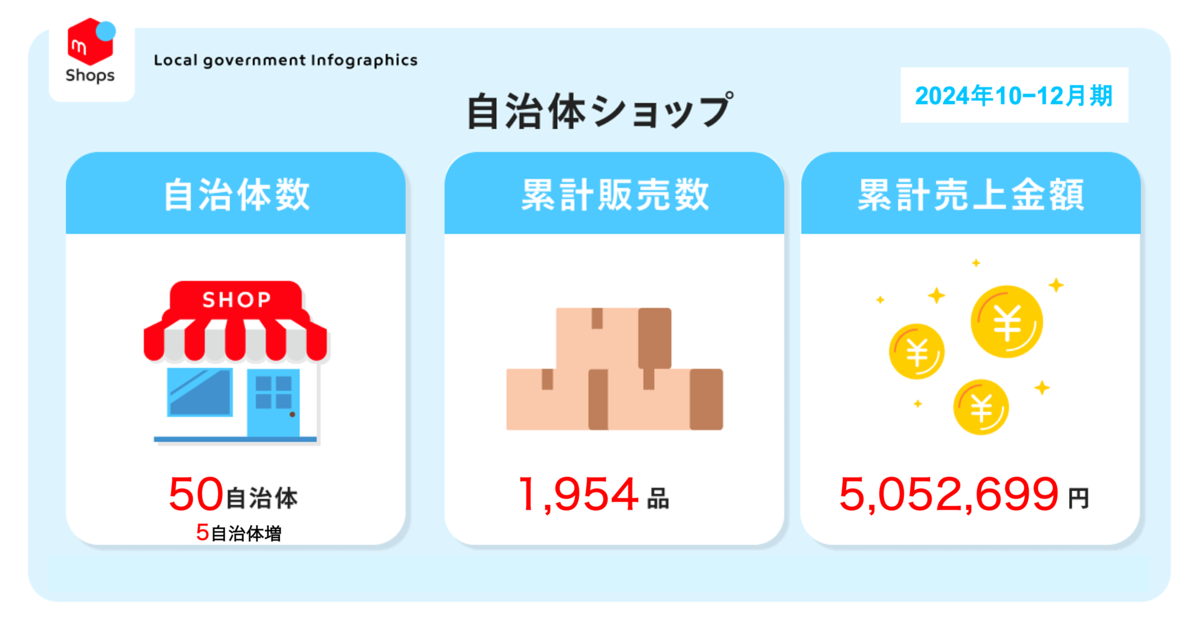
Sales in the last 3 months from October 1 through December 31 totaled 1,954 items and 5,052,699 JPY, meaning that we achieved almost half the year’s sales in just 3 months.
We updated our list of government-run shops on January 1, so please take a look.
Mishima, featured in the media for their efforts selling oversize garbage, earned 1.46M JPY
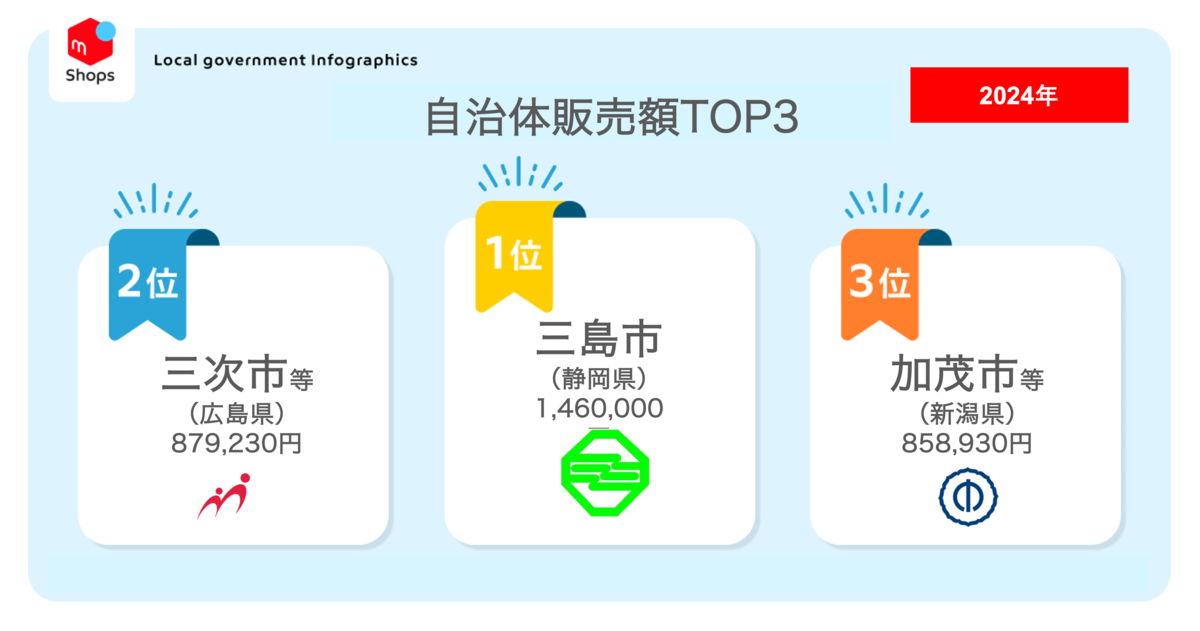
Sales revenue ranking (1-year period—January 1 to December 31, 2024)
- Mishima (Shizuoka) 1.46M JPY (2023: 335,000 JPY, ranked 6th)
- Miyoshi (Hiroshima) 879,230 JPY (2023: outside of top 10) Note: Cumulative figures of 2 shops
- Kamo (Niigata) 858,930 JPY (2023: 799,080 JPY, ranked 2nd) Note: Cumulative figures of 2 shops
- Okayama City (Okayama) 825,100 JPY (2023: 503,800 JPY, ranked 4th)
- Seto (Aichi) 762,000 JPY (2023: outside of top 10)
- Semboku (Akita) 660,560 JPY (2023: outside of top 10)
- Gifu City (Gifu) 632,910 JPY (first ranking)
- Yamagata City (Yamagata) 574,900 JPY (2023: 1,037,900 JPY, ranked 1st)
- Akitakata (Hiroshima) 558,830 JPY (first ranking)
- Gamagori (Aichi) 537,150 JPY (2023: 302,300 JPY, ranked 9th)
Mishima (Shizuoka) had the highest sales revenue in 2024, with 1.46M JPY.
Mishima began selling oversized waste collected from residents in September 2023. Mishima has introduced some unique initiatives, such as offering local pickup and surveying users to find out what they think of the items and what else they would like to buy. These efforts have been widely covered by the media.
We have also published an interview with the person in charge of these initiatives in Mishima, so please take a look.
The second largest sales revenue was Miyoshi (Hiroshima) with 879,230 JPY, and the third largest was Kamo (Niigata) with 858,930 JPY.
Miyoshi began selling unwanted supplies in the municipality in September 2023. Starting in June 2024, in collaboration with Yakult Sanyo, Miyoshi began selling unwanted items from citizens together with Akitakata (Hiroshima).
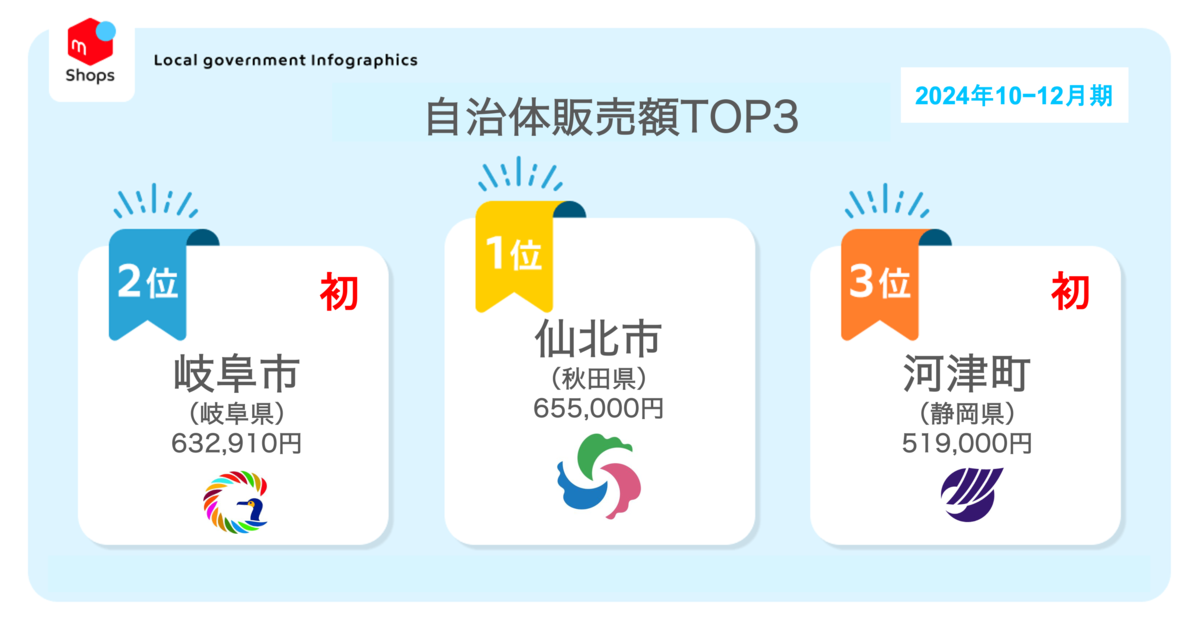
Sales revenue ranking (3-month period—October 1 to December 31, 2024)
- Semboku (Akita) 655,000 JPY (July to September: outside of top 10)
- Gifu City (Gifu) 632,910 JPY (first ranking)
- Kawazu (Shizuoka) 519,000 JPY (first ranking)
- Mishima (Shizuoka) 473,500 JPY (July to September: 275,000 JPY, ranked 2nd)
- Miyoshi (Hiroshima) 340,310 JPY (July to September: 157,190 JPY, ranked 8th) Note: Cumulative figures of 2 shops
- Kaisei (Kanagawa) 308,900 JPY (first ranking)
- Machida (Tokyo) 296,700 JPY (July to September: outside of top 10)
- Akitakata (Hiroshima) 274,310 JPY (July to September: 116,190 JPY, ranked 10th)
- Kamo (Niigata) 238,600 JPY (July to September: 177,650 JPY, ranked 6th) Note: Cumulative figures of 2 shops
- Okayama City (Okayama) 223,600 JPY (July to September: 203,300 JPY, ranked 5th)
Looking at the last 3 months between October and December, Semboku (Akita) had the highest sales revenue with 655,000 JPY.
Semboku began selling unwanted supplies in the municipality in March 2023 and was the first local government in Japan to sell disaster relief supplies that are nearing their expiration date.
The second and third highest sales revenues went to local governments that only started selling in the last 3 months of the year, with Gifu City (Gifu), which started selling in November, at 632,910 JPY and Kawazu (Shizuoka), which started selling in October, at 519,000 JPY.
Mishima also sold the highest number of items, with Okayama City coming in a close second thanks to its efforts selling oversized waste
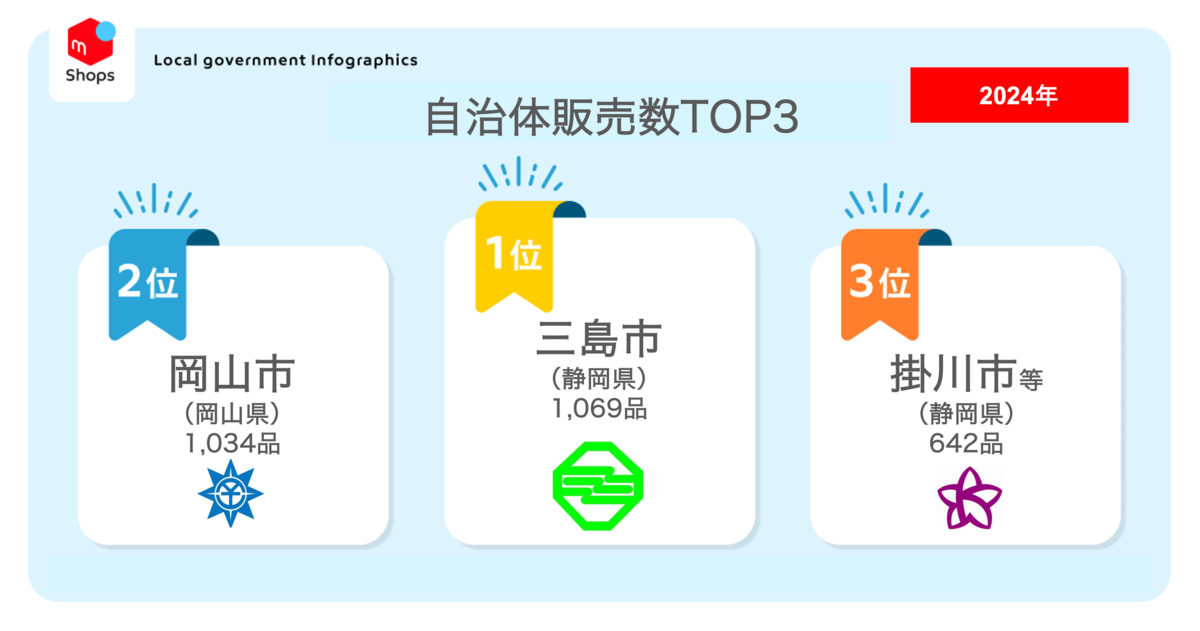
Sales figures ranking (1-year period—January 1 to December 31, 2024)
- Mishima (Shizuoka) 1,069 items (2023: 261 items, ranked 4th)
- Okayama City (Okayama) 1,032 items (2023: 324 items, ranked 1st)
- Kakegawa (Shizuoka) 642 items (2023: 148 items, ranked 6th)
- Nagoya (Aichi) 521 items (2023: 257 items, ranked 5th)
- Gamagori (Aichi) 485 items (2023: 143 items, ranked 7th)
- Miyoshi (Hiroshima) 438 items (2023: outside of top 10) Note: Cumulative figures of 2 shops
- Kamo (Niigata) 311 items (2023: 296 items, ranked 2nd) Note: Cumulative figures of 2 shops
- Seki (Gifu) 301 items (2023: 129 items, ranked 8th)
- Akitakata (Hiroshima) 240 items (first ranking)
- Matsubara (Osaka) 225 items (2023: outside of top 10)
Mishima had the highest sales figures in 2024, with 1,069 items.
Coming in at second place was Okayama City (Okayama) with 1,032 items. Places third to seventh were all occupied by local governments that sell oversized waste, except for Kakegawa (Shizuoka), which sold 642 items.
Runner-up Okayama City opened its shop in March 2023. Before selling on Mercari Shops, Okayama City had an initiative of recycling furniture and other goods donated by residents at two “recycle plazas” in the city. One of those plazas, "Eastern Recycle Plaza," now sells on Mercari Shops in collaboration with staff from the Silver Human Resources Center.
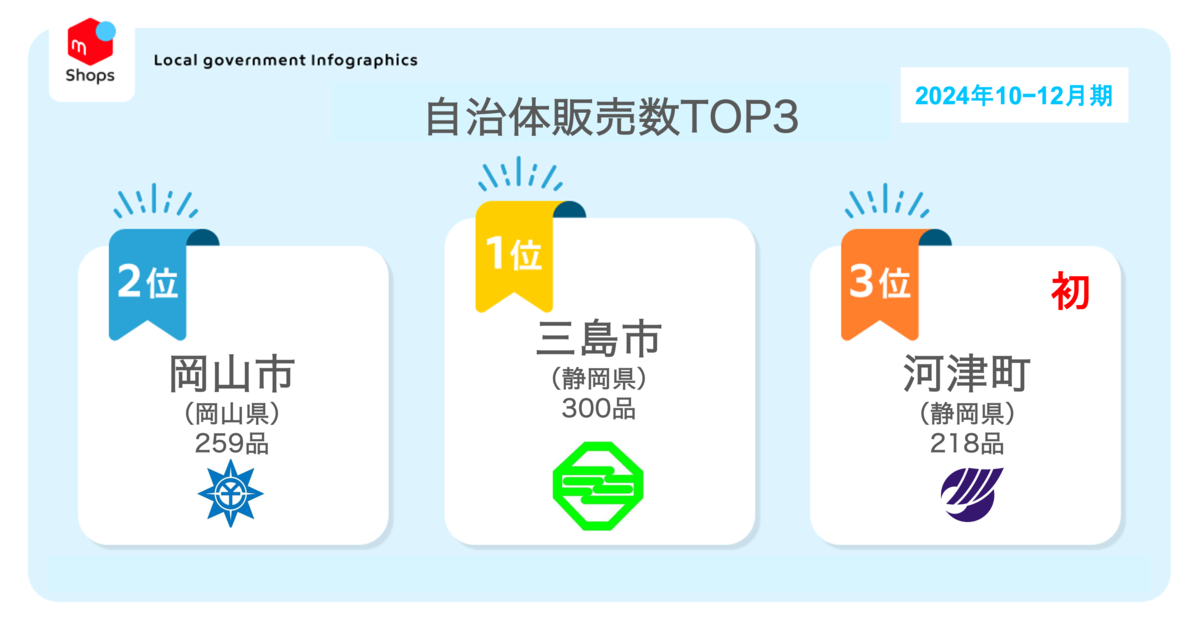
Sales figures ranking (3-month period—October 1 to December 31, 2024)
- Mishima (Shizuoka) 300 items (July to September: 234 items, ranked 2nd)
- Okayama City (Okayama) 259 items (July to September: 273 items, ranked 1st)
- Kawazu (Shizuoka) 218 items (first ranking)
- Gifu City (Gifu) 212 items (first ranking)
- Gamagori (Aichi) 201 items (July to September: 127 items, ranked 5th)
- Kakegawa (Shizuoka) 165 items (July to September: 203 items, ranked 3rd)
- Miyoshi (Hiroshima) 142 items (July to September: 93 items, ranked 8th) Note: Cumulative figures of 2 shops
- Nagoya (Aichi) 129 items (July to September: 126 items, ranked 6th)
- Akitakata (Hiroshima) 105 items (July to September: 65 items, ranked 9th)
- Higashiura (Aichi) 69 items (July to September: outside of top 10) Note: Cumulative figures of 2 shops
Looking at the last 3 months from October to December, Mishima had the highest sales figures with 300 items, followed by Okayama City with 259 items. Kawazu, which only started selling in October, achieved third place in just two months with 218 items. Likewise, Gifu City started selling in November and managed to sell 212 items to rank in fourth.
Mishima ended with the most followers, followed by Nishinomiya; Gifu City had the highest increase in followers over the last 3 months, despite only starting their shop in November

Follower ranking (as of December 31, 2024)
- Mishima (Shizuoka) 6,510 followers (2023: 3,125 followers, ranked 3rd)
- Nishinomiya (Hyogo) 4,563 followers (2023: 4,315 followers, ranked 1st)
- Nagoya (Aichi) 4,461 followers (2023: 3,185 followers, ranked 2nd)
- Yamagata City (Yamagata) 2,666 followers (2023: 1,248 followers, ranked 9th)
- Muroran (Hokkaido) 2,442 followers (2023: 2,405 followers, ranked 4th)
- Gamagori (Aichi) 2,115 followers (2023: 1,724 followers, ranked 5th)
- Okayama City (Okayama) 1,871 followers (2023: 1,497 followers, ranked 6th)
- Kamo (Niigata) 1,725 followers (2023: 1,472 followers, ranked 7th) Note: Cumulative figures of 2 shops
- Gifu City (Gifu) 1,503 followers (first ranking)
- Yamada (Iwate) 1,479 followers (2023: 1,410 followers, ranked 8th)
At the end of 2024, Mishima had the most followers with 6,510, beating out Nishinomiya for the first time. In second and third place were Nishinomiya (Hyogo) with 4,563 followers and Nagoya (Aichi) with 4,461 followers, respectively.
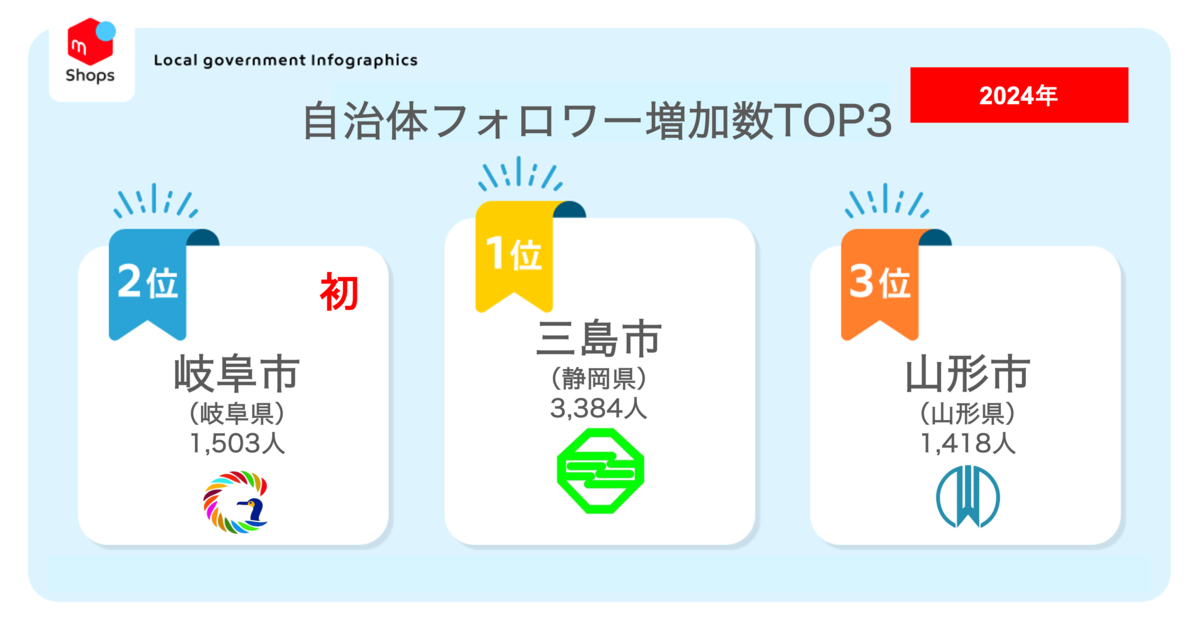
Follower growth ranking (1-year period—January 1 to December 31, 2024)
- Mishima (Shizuoka) 3,384 new followers (2023: 2,203 new followers, ranked 1st)
- Gifu City (Gifu) 1,503 new followers (first ranking)
- Yamagata City (Yamagata) 1,418 new followers (2023: 435 new followers, ranked 4th)
- Nagoya (Aichi) 1,276 new followers (2023: 552 new followers, ranked 3rd)
- Kawazu (Shizuoka) 1,097 new followers (first ranking)
- Higashiura (Aichi) 1,058 new followers, Note: Cumulative figures of 2 shops
- Fukui (Fukui) 769 new followers
- Miyoshi (Hiroshima) 597 new followers (2023: outside of top 10) Note: Cumulative figures of 2 shops
- Yokosuka (Kanagawa) 580 new followers (first ranking)
- Kakegawa (Shizuoka) 527 new followers (2023: 698 new followers, ranked 2nd)
Looking at the increase in followers in 2024, we can see that Mishima increased its follower count by 3,384 followers, marking an almost 100% increase in one year. The next highest jump was 1,503 followers achieved by Gifu City, which started selling in November. While the number of followers tends to grow right after a shop opens, we saw that Yamagata City (Yamagata) and Nagoya (Aichi) had the third and fourth highest increase with 1,418 followers and 1,276 followers, respectively.
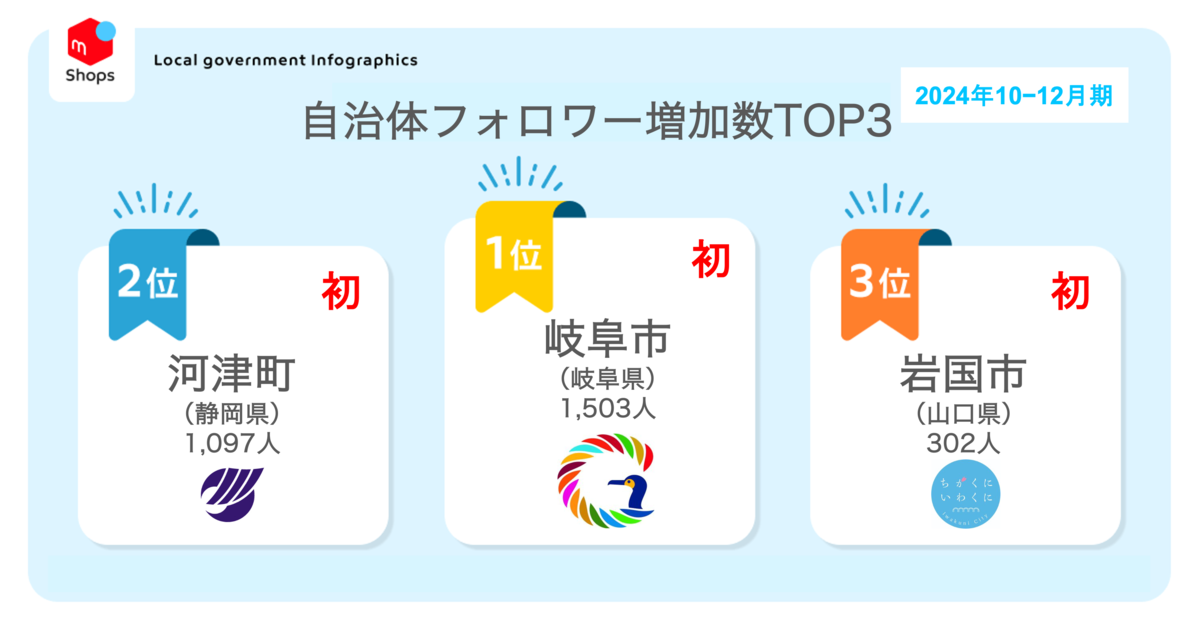
Follower growth ranking (3-month period—October 1 to December 31, 2024)
- Gifu City (Gifu) 1,503 new followers (first ranking)
- Kawazu (Shizuoka) 1,097 new followers (first ranking)
- Iwakuni (Yamaguchi) 302 new followers (first ranking)
- Mishima (Shizuoka) 171 new followers (July to September: 96 new followers, ranked 9th)
- Nagoya (Aichi) 166 new followers (July to September: 143 new followers, ranked 5th)
- Higashiura (Aichi) 154 new followers (July to September: 98 new followers, ranked 8th) Note: Cumulative figures of 2 shops
- Miyoshi (Hiroshima) 130 new followers (July to September: 91 new followers, ranked 10th) Note: Cumulative figures of 2 shops
- Seki (Gifu) 126 new followers (July to September: outside of top 10)
- Gamagori (Aichi) 122 new followers (July to September: 127 new followers, ranked 5th)
- Machida (Tokyo) 118 new followers (first ranking)
Looking at just the last 3 months, Gifu City gained the most followers at 1,503 new followers, followed by Kawazu with 1,097 new followers, and Iwakuni (Yamaguchi) with 302 new followers. All of these shops opened very recently.
Mishima earns most likes in first half of year, followed by Kamo; Kawazu earns most likes in the last 3 months
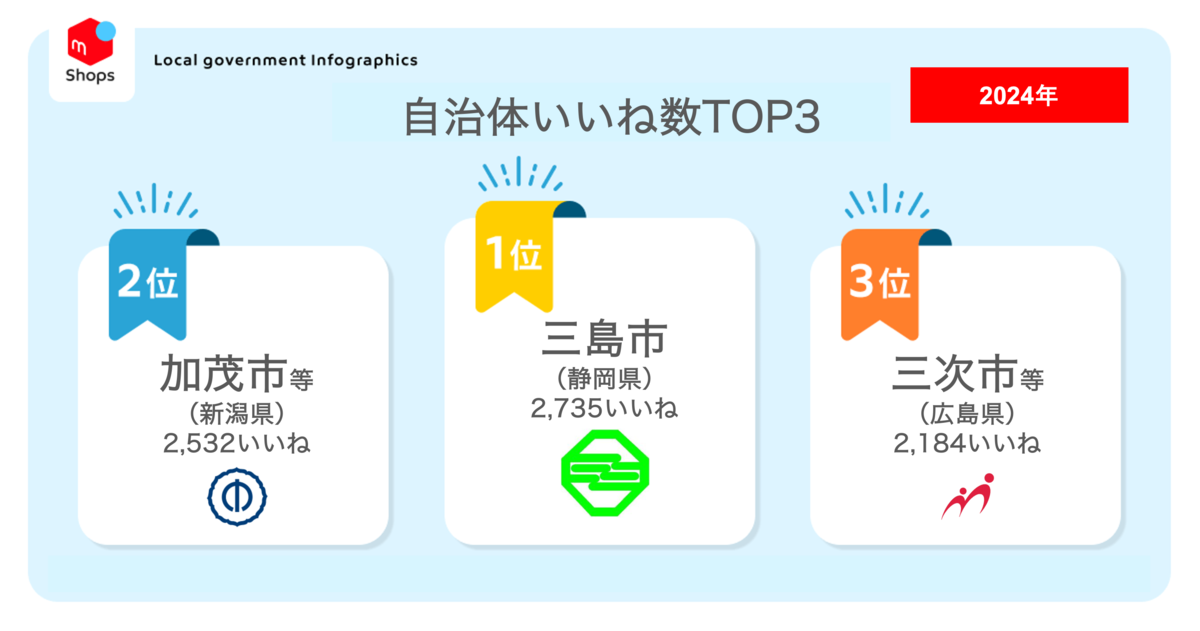
Item “likes” ranking (1-year period—January 1 to December 31, 2024)
- Mishima (Shizuoka) 2,735 likes (2023: 901 likes, ranked 2nd)
- Kamo (Niigata) 2,532 likes (2023: 2,505 likes, ranked 1st) Note: Cumulative figures of 2 shops
- Miyoshi (Hiroshima) 2,184 likes (2023: outside of top 10) Note: Cumulative figures of 2 shops
- Nagoya (Aichi) 1,969 likes (2023: 833 likes, ranked 4th)
- Gamagori (Aichi) 1,876 likes (2023: 750 likes, ranked 6th)
- Higashiura (Aichi) 1,533 likes (first ranking) Note: Cumulative figures of 2 shops
- Akitakata (Hiroshima) 1,508 likes (first ranking)
- Kakegawa (Shizuoka) 1,442 likes (2023: outside of top 10)
- Seki (Gifu) 1,111 likes (2023: 587 likes, ranked 8th)
- Kawazu (Shizuoka) 1,053 likes (first ranking)
Mishima earned the most likes on items, with a total of 2,735 likes. Mishima ranked first for all of sales revenue, sales figures, number of followers, and number of likes.
The next highest number of likes was Kamo with 2,532 likes, followed by Miyoshi with 2,184 likes.
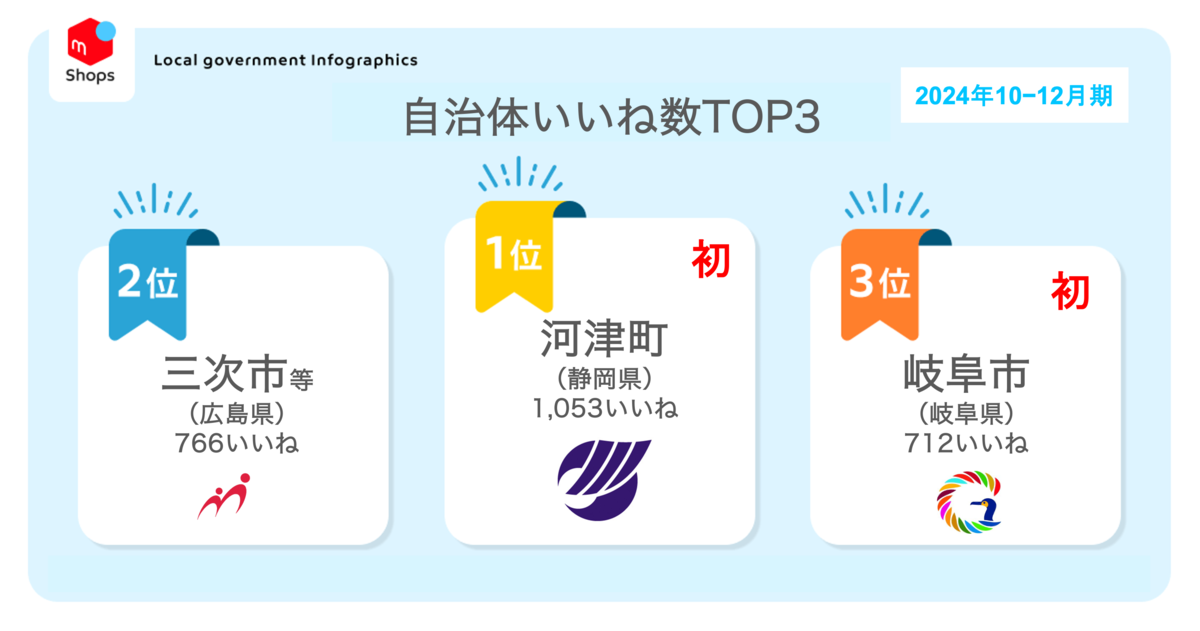
Item “likes” ranking (3-month period—October 1 to December 31, 2024)
- Kawazu (Shizuoka) 1,053 likes (first ranking)
- Miyoshi (Hiroshima) 766 likes (July to September: 505 likes, ranked 3rd) Note: Cumulative figures of 2 shops
- Gifu (Gifu) 712 likes (first ranking)
- Gamagori (Aichi) 674 likes (July to September: 739 likes, ranked 1st)
- Akitakata (Hiroshima) 647 likes (July to September: 419 likes, ranked 7th)
- Mishima (Shizuoka) 637 likes (July to September: 492 likes, ranked 4th)
- Higashiura (Aichi) 556 likes (July to September: 459 likes, ranked 6th) Note: Cumulative figures of 2 shops
- Nagoya (Aichi) 546 likes (July to September: 533 likes, ranked 2nd)
- Seki (Gifu) 369 likes (July to September: 242 likes, ranked 9th)
- Kakegawa (Shizuoka) 327 likes (July to September: 228 likes, ranked 10th)
In the past 3 months, the most likes were received by Kawazu (Shizuoka) with 1,053 likes.
Kawazu began selling in October 2024. With a population of 6,400 people, they have achieved some impressive numbers, ranking 3rd for sales revenue and sales numbers, ranking 2nd for follower growth, and securing the top place for number of likes. Through leveraging technology, Kawazu has shown that model examples can be created regardless of municipality size.
Although we are only partway through the financial year, we decided to share the sales status of local governments on Mercari Shops to mark the end of the calendar year, as well as the sales performance for the last 3 months from October 1 to December 31.
Government-run shops feature a lot of interesting items. We hope that this post will inspire people to consider purchasing from local governments and join us in our efforts to contribute to the promotion of a circular economy with these local governments.
We have also published the following article about our collaboration initiatives with local governments outside of Mercari Shops.
Please take a look.
Mercari will continue its efforts to create a circular economy that reduces waste.
We have also updated our list of government-run shops, so please take a look!
Please see the following articles for information about the past sales performance of each local government.
Yearly sales performance
FY2023 (April 1, 2023 to March 31, 2024)
Up to FY2022 (November 25, 2021 to March 31, 2023)
3-month sales performance
April 1 to June 30, 2024
July 1 to September 30, 2024
|
If you are a local government, company affiliated with a local government, or organization and wish to partner with Mercari, contact us using the following form. (only available in Japanese)
|
Sales performance per local government
As of January 1, 2025 (sales figures and other data are as of December 31, 2024)
Note: Sales performance is indicated by fiscal year (likes are cumulative for the FY2024).
|
R e g i o n |
P r e f e c t u r e |
C i t y |
Purpose of shop |
Start date |
URL |
Followers |
|
Units sold |
Sales revenue |
Likes |
||||
|
H o k k a i d o |
01 H o k k a i d o |
09 M u r o r a n |
Supplies |
2023/2/1 |
2,442 |
|
|
91 2024: 8 2023: 36 2022: 47 |
350,800 JPY 2024: 24,500 JPY 2023: 132,500 JPY 2022: 193,800 JPY |
39 |
||||
T o h o k u |
03 I w a t e |
01 Y a m a d a |
Supplies |
2021/11/25 |
1,479 |
|
|
231 2024: 19 2023: 43 2022: 128 2021: 41 |
1,930,100 JPY 2024: 167,000 JPY 2023: 371,000 JPY 2022: 1,153,800 JPY 2021: 238,300 JPY |
116 |
||||
|
05 A k i t a |
13 S e m b o k u |
Supplies |
2023/3/29 |
661 |
||
|
64 2024: 22 2023: 16 2022: 26 |
730,560 JPY 2024: 658,000 JPY 2023: 47,260 JPY 2022: 25,300 JPY |
78 |
||||
|
06 Y a m a g a t a |
10 Y a m a g a t a |
Supplies |
2023/2/26 |
2,666 |
||
|
502 2024: 164 2023: 308 2022: 30 |
1,612,800 JPY 2024: 446,400 JPY 2023: 1,078,800 JPY 2022: 87,600 JPY |
462 |
||||
|
K a n t o |
08 I b a r a k i |
16 N a m e g a t a |
Oversized waste |
2023/6/5 |
193 |
|
|
11 2024: 0 2023: 11 |
45,000 JPY 2024: 0 JPY 2023: 45,000 JPY |
0 |
||||
|
39 K a s h i m a |
Supplies |
2024/8/20 |
373 |
|||
|
10 2024: 10 |
40,300 JPY 2024: 40,300 JPY |
124 |
||||
|
13 T o k y o |
32 K o k u b u n j i |
Supplies |
2024/4/9 |
519 |
||
|
82 2024: 82 |
41,000 JPY 2024: 41,000 JPY |
233 |
||||
|
41 M a c h i d a |
Supplies |
2024/8/22 |
135 |
|||
|
47 2024: 47 |
357,900 JPY 2024: 357,900 JPY |
352 |
||||
|
14 K a n a g a w a |
08 K a m a k u r a |
Supplies |
2023/1/30 |
786 |
||
|
35 2024: 2 2023: 10 2022: 23 |
412,500 JPY 2024: 100,000 JPY 2023: 149,000 JPY 2022: 163,500 JPY |
12 |
||||
|
33 Y o k o s u k a |
Supplies |
2024/4/23 |
580 |
|||
|
55 2024: 55 |
176,000 JPY 2024: 176,000 JPY |
323 |
||||
|
44 H a y a m a |
Supplies |
2024/9/17 |
34 |
|||
|
4 2024: 4 |
3,400 JPY 2024: 3,400 JPY |
26 |
||||
|
48 K a i s e i |
Supplies |
2024/10/29 |
55 |
|||
|
7 2024: 7 |
308,900 JPY 2024: 308,900 JPY |
61 |
||||
K o s h i n e t s u |
15 N i i g a t a |
04 K a m o |
Total |
2022/5/30 |
- |
1,725 |
|
618 2024: 227 2023: 327 2022: 64 |
1,708,519 JPY 2024: 695,380 JPY 2023: 778,480 JPY 2022: 234,659 JPY |
1,669 |
||||
|
Oversized waste |
2022/5/30 |
1,170 |
||||
|
478 2024: 196 2023: 237 2022: 45 |
1,439,599 JPY 2024: 636,280 JPY 2023: 641,730 JPY 2022: 161,589 JPY |
1,541 |
||||
|
Supplies |
1,541 |
555 |
||||
|
140 2024: 31 2023: 90 2022: 19 |
268,920 JPY 2024: 59,100 JPY 2023: 136,750 JPY 2022: 73,070 JPY |
128 |
||||
|
17 I s h i k a w a |
46 N a k a n o t o |
Supplies |
2024/10/1 |
55 |
||
|
12 2024: 12 |
62,000 JPY 2024: 62,000 JPY |
157 |
||||
|
18 F u k u i |
34 F u k u i |
Oversized waste |
2024/5/29 |
769 |
||
|
91 2024: 91 |
100,040 JPY 2024: 100,040 JPY |
445 |
||||
|
19 Y a m a n a s h i |
17 H o k u t o |
Supplies/ Oversized waste |
2023/6/5 |
224 |
||
|
20 2024: 1 2023: 19 |
61,580 JPY 2024: 5,400 JPY 2023: 56,180 JPY |
20 |
||||
|
20 N a g a n o |
18 O m a c h i |
Supplies |
2023/6/5 |
325 |
||
|
40 2024: 5 2023: 35 |
67,780 JPY 2024: 7,500 JPY 2023: 60,280 JPY |
28 |
||||
|
30 N a k a n o |
Supplies |
2024/2/21 |
405 |
|||
|
128 2024: 81 2023: 47 |
354,430 JPY 2024: 181,140 JPY 2023: 173,290 JPY |
382 |
||||
|
T o k a i |
21 G i f u |
19 S e k i |
Supplies |
2023/6/5 |
752 |
|
|
430 2024: 253 2023: 177 |
914,300 JPY 2024: 287,200 JPY 2023: 627,100 JPY |
848 |
||||
|
20 I b i g a w a |
Supplies |
2023/6/5 |
Supplies |
|||
|
92 2024: 53 2023: 39 |
350,900 JPY 2024: 196,400 JPY 2023: 154,500 JPY |
204 204 |
||||
28 Y a m a g a t a |
Supplies |
2023/11/29 |
130 |
|||
|
13 2024: 1 2023: 12 |
85,900 JPY 2024: 3,700 JPY 2023: 82,200 JPY |
30 |
||||
|
43 O g a k i |
Oversized waste |
2024/9/2 |
112 |
|||
|
24 2024: 24 |
15,900 JPY 2024: 15,900 JPY |
120 |
||||
|
49 G i f u |
Supplies |
2024/11/4 |
1,503 |
|||
|
212 2024: 212 |
632,910 JPY 2024: 632,910 JPY |
712 |
||||
|
22 S h i z u o k a |
22 M i s h i m a |
Oversized waste |
2023/9/6 |
6,510 |
||
|
1,330 2024: 800 2023: 530 |
1,795,000 JPY 2024: 1,128,000 JPY 2023: 667,000 JPY |
1,909 |
||||
|
26 K a k e g a w a |
Oversized waste |
2023/10/20 |
1,225 |
|||
|
790 2024: 464 2023: 326 |
506,300 JPY 2024: 264,000 JPY 2023: 242,300 JPY |
1,038 |
||||
|
40 S u s o n o |
Oversized waste |
2024/8/22 |
233 |
|||
|
36 2024: 36 |
34,700 JPY 2024: 34,700 JPY |
118 |
||||
|
47 K a w a z u |
Supplies |
2024/10/28 |
1,097 |
|||
|
218 2024: 218 |
519,000 JPY 2024: 519,000 JPY |
1,053 |
||||
23 A i c h i |
14 A i c h i |
Supplies |
2023/6/5 |
271 |
||
|
13 2024: 6 2023: 7 |
38,800 JPY 2024: 19,600 JPY 2023: 19,200 JPY |
2024: 19,600 JPY 2023: 19,200 JPY |
||||
|
27 S e t o |
Supplies |
2022/1/13 |
1,241 |
|||
|
105 2024: 1 2023: 20 2022: 53 2021: 31 |
1,157,200 JPY 2024: 750,000 JPY 2023: 87,000 JPY 2022: 166,000 JPY 2021: 154,200 JPY |
15 |
||||
|
03 G a m a g o r i |
Oversized waste / Supplies |
2022/5/30 |
2,115 |
|||
|
661 2024: 484 2023: 128 2022: 49 |
901,550 JPY 2024: 536,250 JPY 2023: 272,500 JPY 2022: 92,800 JPY |
1,827 |
||||
|
15 N a g o y a |
Oversized waste |
2023/6/5 |
4,461 |
|||
|
778 2024: 384 2023: 394 |
552,900 JPY 2024: 273,800 JPY 2023: 279,100 JPY |
1,537 |
||||
|
27 O w a r i a s a h i |
Supplies |
2023/11/20 |
104 |
|||
|
67 2024: 23 2023: 44 |
110,000 JPY 2024: 32,600 JPY 2023: 77,400 JPY |
165 |
||||
|
31 H i g a s h i u r a |
Total |
2024/4/4 |
- |
1,058 |
||
|
145 2024: 145 |
216,990 JPY 2024: 216,990 JPY |
1,533 |
||||
|
Oversized waste |
2024/4/4 |
527 |
||||
|
140 2024: 140 |
184,290 JPY 2024: 184,290 JPY |
1,227 |
||||
|
Supplies |
2024/4/4 |
531 |
||||
|
5 2024: 5 |
32,700 JPY 2024: 32,700 JPY |
306 |
||||
|
45 M i n a m i c h i t a |
Supplies |
2024/9/17 |
138 |
|||
|
57 2024: 57 |
205,700 JPY 2024: 205,700 JPY |
278 |
||||
K a n s a i |
26 K y o t o |
38 N a n t a n |
Supplies |
2024/7/8 |
110 |
|
|
14 2024: 14 |
262,800 JPY 2024: 262,800 JPY |
68 |
||||
|
42 K a m e o k a |
Supplies |
2024/8/27 |
189 |
|||
|
38 2024: 38 |
182,080 JPY 2024: 182,080 JPY |
248 |
||||
|
27 O s a k a |
07 M a t s u b a r a |
Supplies |
2023/1/22 |
384 |
||
|
289 2024: 214 2023: 60 2022: 15 |
597,900 JPY 2024: 465,900 JPY 2023: 113,000 JPY 2022: 19,000 JPY |
477 |
||||
|
28 H y o g o |
06 N i s h i n o m i y a |
Oversized waste |
2022/10/24 |
4,563 |
||
|
74 2024: 22 2023: 26 2022: 26 |
102,100 JPY 2024: 27,000 JPY 2023: 35,500 JPY 2022: 39,600 JPY |
147 |
||||
|
29 N a r a |
21 O y o d o |
Supplies |
2023/6/5 |
170 |
||
|
37 2024: 17 2023: 20 |
36,735 JPY 2024: 19,095 JPY 2023: 17,640 JPY |
67 |
||||
|
C h u g o k u |
31 T o t t o r i |
05 N a m b u |
Vacant houses |
2022/9/21 |
284 |
|
|
24 2024: 10 2023: 3 2022: 11 |
52,100 JPY 2024: 21,000 JPY 2023: 6,000 JPY 2022: 25,100 JPY |
116 |
||||
|
33 O k a y a m a |
12 O k a y a m a |
Oversized waste |
2023/3/14 |
1,871 |
||
|
1,356 2024: 780 2023: 567 2022: 9 |
1,328,900 JPY 2024: 616,600 JPY 2023: 676,800 JPY 2022: 35,500 JPY |
691 |
||||
| 34 H i r o s h i m a |
24 M i y o s h i |
Total |
|
- |
1,143 |
|
|
466 2024: 331 2023: 135 |
1,053,530 JPY 2024: 716,630 JPY 2023: 336,900 JPY |
1,816 |
||||
|
Oversized waste |
2024/6/5 |
370 |
||||
|
225 2024: 225 |
536,630 JPY 2024: 536,630 JPY |
1,458 |
||||
|
Supplies |
2023/9/28 |
773 |
||||
|
241 2024: 106 2023: 135 |
516,900 JPY 2024: 180,000 JPY 2023: 336,900 JPY |
358 |
||||
|
29 K i t a h i r o s h i m a |
Supplies |
2024/1/10 |
177 |
|||
|
17 2024: 4 2023: 13 |
64,659 JPY 2024: 29,554 JPY 2023: 35,105 JPY |
34 |
||||
|
35 A k i t a k a t a |
Oversized waste |
2024/6/5 |
370 |
|||
|
225 2024: 225 |
536,630 JPY 2024: 536,630 JPY |
1,458 |
||||
|
37 H a t s u k a i c h i |
Supplies |
2024/6/25 |
113 |
|||
|
3 2024: 3 |
900 JPY 2024: 900 JPY |
65 |
||||
35 Y a m a g u c h i |
36 S h u n a n |
2024/6/17 |
461 |
|||
|
23 2024: 23 |
144,500 JPY 2024: 144,500 JPY |
220 |
||||
|
50 I w a k u n i |
Supplies |
2024/11/20 |
302 |
|||
|
22 2024: 22 |
126,900 JPY 2024: 126,900 JPY |
144 |
||||
|
S h i k o k u |
36 T o k u s h i m a |
11 T o k u s h i m a |
Supplies |
2023/2/17 |
632 |
|
|
30 2024: 3 2023: 15 2022: 12 |
138,012 JPY 2024: 14,300 JPY 2023: 40,312 JPY 2022: 83,400 JPY |
30 |
||||
|
37 K a g a w a |
25 S a k a i d e |
Supplies |
2023/9/29 |
442 |
||
|
33 2024: 15 2023: 18 |
358,900 JPY 2024: 36,600 JPY 2023: 322,300 JPY |
65 |
||||
|
K y u s h u |
43 K u m a m o t o |
23 K u m a m o t o |
Education |
2023/9/12 |
https://mercari-shops.com/shops/VjRFCSMJLc6DFr6UeJGXjj | |
|
63 2024: 0 2023: 63 |
224,943 JPY 2024: 0 2023: 224,943 JPY |
0 |
||||
*The figures for Yakult Sanyo include those for both Miyoshi and Akitakata.